I have been working with data vizualisation and fact based decision making for many years.
A year ago, I started experimenting with ELK Stack.
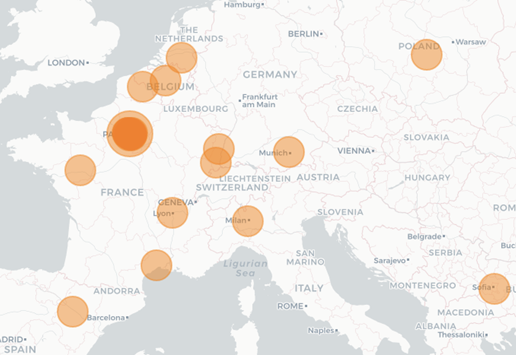
It was fairly easy to make a simple reporsitory of business trips. In the process I discovered how to use Grafana to make dashboards available from a server, and the use of Google Maps API to get GPS coordinnates from a postal address.
One of the result is a nice little Dashboard that enables me to track all the Customers I helped in 2017:
There are many more vizualisation possibilities to support decision making with facts… I will elaborate more soon.
Here are some of the learning out of this experiment :
- How to create a repository and indexes
- How to insert data from a file using Logstash
- Using Kibana to test data and create simple vizualisations
- Add fields to existing repository
- Create and Restore archive
- Create a simple PHP app to provide a form to insert Data in ElasticSearch
- Server side connection to Google API to get GPS coordinates from a postal address
- Setup http server on Mac OS using Brew
